Poor man’s Thread Profiler
2/Nov 2008
There’s an interesting observation in Eric Steven Raymond’s essay - ‘The Cathedral and the Bazaar’ (I’ve heard about it thanks to the reference in ‘Dreaming in Code’). Eric notices: “Every good work of software starts by scratching a developer’s personal itch’. It seems to me like my problem is I’ve too many itches. When I was a young bedroom coder I’ve been basically scratching constantly. Every time I’ve learned about some new technique, I couldn’t resist and just had to try it in my code. Sometimes, this would mean starting the whole thing almost from scratch, so I had crazy problems with actually finishing stuff. It’s better now, because I learned to control it to a certain degree. Old habits die hard, though, and I noticed it when experimenting with occlusion culling (recent note). For some reason, the first version of my multithreaded triangle rasterizer would run slower than the singlethreaded one. Intel’s Thread Profiler evaluation period finished long time ago, so this seemed like a perfect excuse to waste some time coding a simple analyzer myself.
Basic idea is trivial. I’ve wrappers over all low-level thread operations, so in every critical function I can signalize it has been called. Then, when program finishes, all this information is saved to file and can be analyzed with external application. In order to minimize overhead and make things easier, events are stored in TLS, so that we don’t need to bother with locks. Only when they’re gathered together, more precautions are taken. I use QueryPerformanceCounter for timing. It has bigger overhead than RDTSC, but is (supposedly) more reliable. There’s a possibility to switch to RDTSC if needed.
Analysis is done in simple C# application. Let’s see the results of my first test:
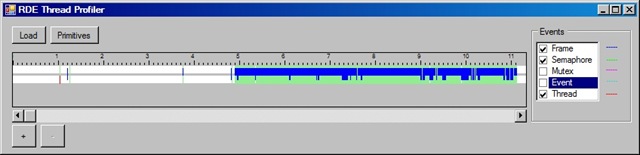
Blue lines mark frame starts, green lines mark semaphore wait starts. Top bar is drawing thread, bottom - main thread. As you can hopefully see (click the picture for bigger view) as soon as the application starts working for real, it’s just a big green blob, meaning lots of semaphore operations. Let’s zoom in a little bit.
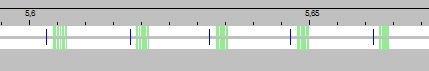
OK, now it’s a little clearer. For every frame we seem to have a certain number of semaphore waits, while I expected 1 per thread (drawing thread waiting for work, main thread waiting for drawing thread to finish). As it quickly turned out after looking in the code, I perform drawing on per-mesh basis, instead of gathering all the triangles for the whole scene and rasterize them together. Let’s fix it and see the results.
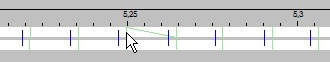
Ah, now we’re talking. One semaphore wait for drawing thread, one for main thread. Diagonal line marks the duration of wait for semaphore selected with the cursor. As you can see, it’s roughly one frame for drawing thread. Let’s see what semaphore it is - double-click it:
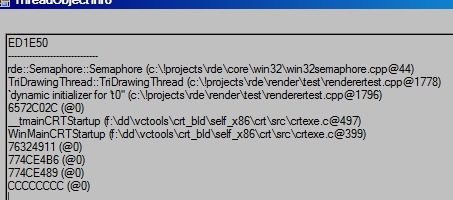
After consulting the code, we can confirm it’s - as expected - semaphore on which drawing thread waits for more work. Waiting time seems reasonable in such case (we draw what we have to draw, then wait for the next frame).
There are some other features, like listing all threading primitives (with creation call-stacks), global statistics (running time, frames, threading operation per frame) etc. However, in this case, the analyzer itself is less interesting, it’s the raw data that’s important. After that it’s only a matter of interpreting/presenting it. I intend to extend it’s functionality in the future, but all the data is already there.
Of course, this solution has several shortcomings (timing problems mainly) and it should be used for any kind of really detailed analysis, go with ITP here. However, if you just want to see if your application behaves in a way you expect it to, or if there are no obvious mistakes - it sounds viable.
C++ part of the experiment can be downloaded here: ThreadProfiler.h + ThreadProfiler.cpp. It won’t compile as is, because it requires my wrappers, but it should be easy enough to adapt’ And I can return to what I was originally planning to do, before it started to itch.
Old comments
Uzair 2009-02-26 17:48:59
Hi Maciej,
What’s the right way to populate the ModuleDesc struct? Never had good experiences with DbgHelp stuff!
Cheers :)
admin 2009-02-27 21:07:01
Simplest way is to use combination of EnumerateLoadedModules64, SymLoadModule64 and SymGetModuleInfo64 (inside enumeration callback, see MSDN for details).