Remote debugging in Visual Studio
23/Jan 2010
Today I’d like to describe a relatively unknown feature of Visual Studio that can be extremely useful in certain situations - remote debugging. Remember all those situations when application work perfectly on your machine, but crashes on tester’s? ‘Old school’ way of trying to debug this problem was to add a very detailed logging, then analyze it. Fortunately, there is a more convenient method - we can simply connect to his machine and attach debugger to running application. Setting it up is relatively simple and boils down to the following steps (machine A = tester’s machine with application running, machine B = developer’s machine with Visual Studio):
‘install’ Remote Debugger on machine A. It should be located in in Visual Studio dir/Common7/IDE/Remote Debugger/[architecture type], just copy the whole folder,
run msvsmon.exe on machine A,
set debugging permissions. In a typical scenario of both computers in same (safe) company network just select the following from Options menu: No special permission needed, Allow any user to debug,
msvsmon log window should read something along the lines of: ‘Msvsmon started a new server named ‘XXX:port’. Waiting for new connections’.
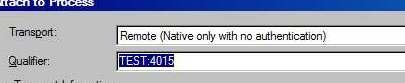
machine B - run Visual Studio, select Debug ‘> Attach to Process. Transport: Remote, then enter machine A’s address/listening port in Qualifier. If done correctly, it should display a list of running processes. Select your application and tap ‘Attach’.
That should be all that’s needed. Just little note about symbols: when debugging native code, up-to-date symbol files (*.PDB) should be present on machine B, otherwise you’ll have problems with source level debugging. Remote debugging may be not as convenient as local debugging as in many cases it means analyzing optimized code (for bugs that only happen in final builds), but it surely can be a life saver.
Old comments
admin 2010-01-30 12:01:17
Another way is to use two monitors (app on one, VS on the other).
KidJ 2010-01-30 08:44:05
This is awesome for debugging bugs caused by getting/losing focus on your apps window. When debugging this locally it’s a pain to use breakpoints as they snatch focus away from the app you’re debugging to give it to vis studio - nightmare. Debugging remotely the app just behaves as normal.
Riddlemaster 2010-01-25 11:11:38
Thanks for info! Very helpful… no more guessing what went wrong.
No 2010-01-25 13:11:47
Another question:
Is it possible to debugg an application, which does not respond anymore?
admin 2010-01-25 16:24:00
@No: not sure to be honest, don’t remember if I tried this. I’d assume it behaves same way as when trying to attach to local application that doesn’t respond.
Sobol 2010-01-23 10:24:15
Damn man, I love you! That’s one of the best blog entries I have ever read. The only problem can be non public IP of machine A, but stuff like Hamachi can solve it.
admin 2010-01-23 12:21:21
It probably varies from case to case, but in my experience both machines were always in the same network (company’s), so no additional trickery required.
Reg 2010-01-24 13:47:29
Do you mean the tester A must have BOTH Visual Studio AND this additional “remote debugger” installed?
ed 2010-01-24 19:51:43
You can also setup remote debbuging in the Project Properties. This way you will be able to remotely start/restart the game whenever you want (without the need to attache to existing process).
admin 2010-01-24 21:02:07
Reg: No, that’s the whole point. Tester only needs Remote Debugger (10mb, doesn’t even have to be installed).