MemTracer strikes back
5/Apr 2008
You may remember my proof-of-concept experiment - MemTracer. It started as a hobby project, but recently I had chance to test it in a real world application. It quickly turned out there’s a big difference between my simple test program and full blown game performing hundreds of memory operations per second.
Below you can find list of conclusions I drew from this experience:
realtime analysis is next to useless. Things change too quickly anyway and it slows down the execution of client application significantly. You’ll want to do as little work in receiving thread as possible. Avoid switching threads/updating controls if you can. I just record memory operations for later analysis and update some really basic informations (on timer, not from receiving thread, Invoke() seems very slow). If you record every memory operation (alloc/free) and frame markers, you can recreate complete history easily at any given moment. All the more complicated structures are built on request, not while recording.
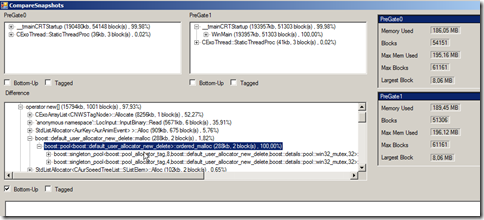
the simplest way to intercept all memory operations is to use Detours. I recommend starting with tracing only internal allocations, though (operator new/your own routines). Intercepting HeapAlloc and family causes some additional problems, because number of memory operations to handle skyrockets then, especially DirectSound seems to allocate like crazy. What’s more dangerous, sockets can allocate memory as well, so you’ll need some kind of mechanism to prevent neverending loops. Simple way to limit noise/signal ratio is to only consider memory blocks bigger than some threshold (say 1kb). Worked really well in my case, most of the low-level applications are parts of bigger structures anyway, so if you eliminate big leak, you’ll get the small ones as well. If really needed, after finishing with big leaks, we can track small blocks only. Divide & conquer, baby.
StackWalk64 is reliable, but slow. It may not be noticeable normally, but in places with big amount of memory applications (loading big levels for example) it really does slow program down. Use EBP/ESP walk or RtlCaptureStackBackTrace function when possible (you may need to fall back to StackWalk64 for some modules with FPO).
you’ll want to use some tricks to cut down your client application memory usage. After my first tries it tended to run out of memory on longer tests. Basic modifications I made to reduce memory footprint were:
tags were 4CC codes by default. If some block needed longer tag, I would only store CRC per block (same field as 4CC), real entry would go to global dictionary.
similar situation with callstack. Instead of keeping 20+ entries for every block, I only stored callstack CRC. This also speeds callstack comparisons up.
it is essential that your tool is 100% reliable. Nothing’s worse than false alarms, they can make you bark at the wrong tree for hours, only to find out everything was right, it’s bug in the tool. Make sure it works in every situation before adding fancy features. It took me some time, but now I’m at stage when if MemTracer reports something leaks – it leaks, no matter how improbable the callstack may seem. Simplifies life, really, because I dont have to double check every time. Make sure allocations are caught properly in the game, that every packet sent from the game reaches the tracer, that every allocation in the tracer is recorded properly.
last, but not least - make sure your sockets work in non-blocking mode (or run sending in another thread) :). Took me some minutes to figure out why the game suddenly slowed down to a crawl after I connected to it. It is a little bit more work (for example socket may not be always ready for sending more data etc), but it definitelly pays off. You may start with blocking sockets for quick’n’dirty start, of course.
I also extended MemTracer’s functionality. Many of the ideas employed were stole^H^H^H^H, err, inspired by aforementioned van der Beek’s article. I’ll show most interesting features here, so hopefully you can be “inspired” as well :>. Figure 1 shows application main panel. The only weird control here is filter combobox, used to track memory stats for various allocators, it lets to display statistics only for blocks with selected tag.
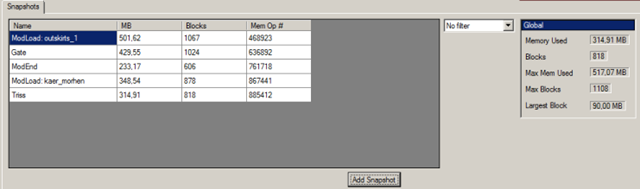
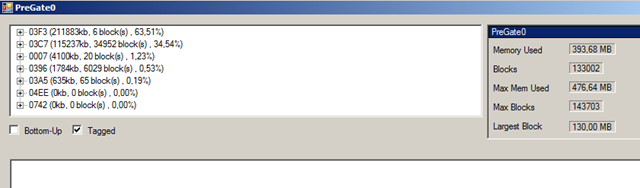
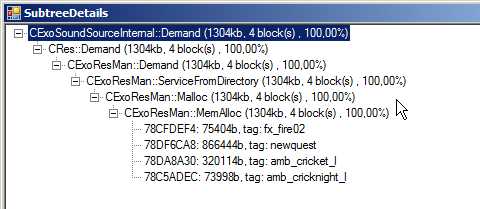
Tag is either 4CC or string up to 32 characters. Block can be either tagged at allocation time or any moment later, via separated message. It’s very useful for identifying resources for example. Tagging blocks is easy when tracking only internal allocations, becomes a little harder when intercepting all calls, because for example single CreateTexture() call may result in multiple HeapAllocs, we’d like to tag all the blocks with texture name obviously. In order to achive this, I introduced a concept of “tag stack”. If it’s not empty, every allocated block is tagged with entry from top of the stack. So, you push texture name before creating it, pop after and it tags all the blocks allocated between those calls.
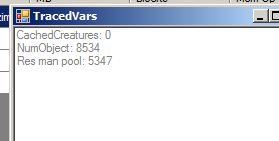
MemTracer contains also bonus feature - traced variables. Application can send current value of every variable it wants to trace, every time it changes. Typical candidates would be variables like number of objects, number of models, textures and so on. It makes spotting connections easier. Number of game objects keep growing and growing during gameplay? Something’s wrong, let’s take closer look. Sound cache size doesnt seem to be limited? May need further investigation.
I dont really plan to extend MemTracer any further. It started as an experiment, morphed to something semi-usable and served its purpose. Modifications that would need to be made in order to make it more universal:
- support for DLL injecting. Right now the application has to include custom C++ code and call some functions. DLL injecting would allow to examine third party executables. Didnt bother to implement it as I wanted only to check my code anyway. Plus, the advantages are biggest if you can provide some extra information about memory usage (like tags).
- heap view I mentioned in the previous article, still not done. Problem is, while it could be rather easily done for user managed sub-heaps, to visualize it for system heap would most probably require crazy amounts of memory (need to store heap state for every frame… perhaps could be compressed by storing deltas only, something to consider).
- ability to “import” and combine information from multiple sessions. It’d show snapshots from all imported sessions and allow for normal operations on them (compare, details etc).
Old comments
realtimecollisiondetection.net - the blog » Posts and links you should have read 2008-09-02 15:34:21
[…] is clearly a bit too PC-centric, so pinch of salt for consoles). Also read Maciej Sinilo’s MemTracer strikes back post. BTW, before you even attempt to write your own heap memory manager, you should understand […]