Intel Thread Profiler

Few days ago I decided to have closer look at my multi-threaded experiments, mainly to check if there really is any kind of difference between code based on locks and lock-free version. Downloaded evaluation version of Intel Thread Profiler and gave it a try. Especially for this experiment, I modified scenario a little bit. Mandelbrot is not the best test as tasks take relatively long time (with selected number of iterations one ‘frame’ would take over 2 seconds). I replaced it with animating 2000 meshes (transforming all vertices with CPU), duration of single task depended on number of vertices, but program was running about 30 frames per second.

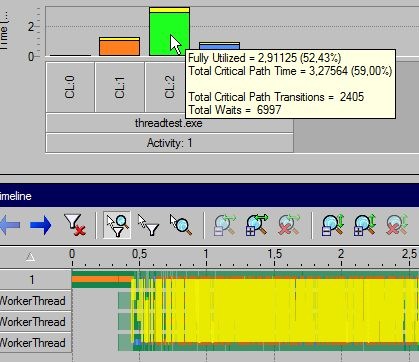
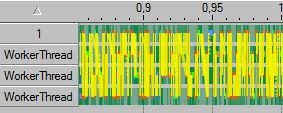
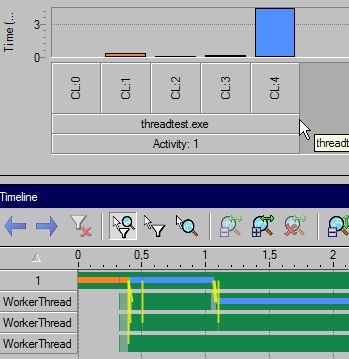
Let’s start with first, basic version with critical section. Every access to task queue is guarded with locks. Worker threads wait on semaphore and they’re activated as soon as there’s some job for them. Rather straightforward solution, really. Hopefully I didnt do anything stupid, locks are held for shortest duration possible (released before executing task etc). Every frame we add our animation tasks, then main thread fakes some job it has to do and finally wait for worker threads to finish animating. Let’s run it under ITP, result shown at Figure 1.

Figure 1: Lock-based implementation

Quick explanation in case you’re not familiar with this package. Top window shows concurrency level (0, 1, 2, 3 & 4 in our case). Level 1 means single thread, 2 - two threads working and so on. Tests were run on dual-core machine, so in theory I should have less worker threads, but I wanted to stress test it a little bit. Lower pane is ‘timeline view’ and this ugly yellow bars mark transitions (to quote documentation: ‘The execution flow between threads where one thread signals to another thread waiting to receive that signal’). As you can see it doesnt look too good, but it’s a little bit exaggerated by the scale of this graph, let’s zoom in (5ms).

Figure 2: Lock-based implementation, zoomed.

OK, now at least we can see something, but still far from perfection. By examining summary tab it looks like most of the contended API calls are critical-section related (access to the task queue). Average concurrency for this test is 1.99, with 5902.61 transitions per second (do not pay too much attention to this, it may vary quite significantly from run to run, still it’s one more indicator).

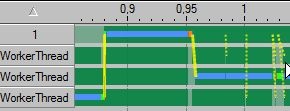
Another try - naive lock-free implementation. Lock-free FIFO task queue, semaphores for communication between main/worker threads. Result:

Figure 3: Naive lock-free implementation.

This looks more like it. Basically, there are two kind of yellow bars here - one is when worker threads wait for some tasks to do and another is when main thread waits for them to finish. See Figure 4 for zoomed version.

Figure 4: Naive lock-free implementation, zoomed.

Blue color means we’re over-utilized most of the time, but dont worry about it now (as I said, test uses too many worker threads). If I ignore initial orange bar (setup, worker threads not working yet), there are usually three (44.43% of time) or four (36.43%) threads working. Average concurrency is 3.04 with 57.36 transitions per second. It’s better, but still not perfect. I tried to find a way to eliminate as many semaphore waits as possible. In this naive implementation, when the worker thread cannot retrieve tasks for the queue, it immediately goes to sleep and waits on the semaphore, which is signalized by main thread when new task is added. This is not the best solution, because new task may appear just few ticks later. I found nice trick in Intel’s Threading Building Blocks. Their scheduler is way more complicated/advanced than mine, it also follows another philosophy (inspired by Cilk). Every worker thread has its own task queue, if it’s empty it tries to steal work from another thread. It wont sleep immediately, instead spin a little bit trying to steal something (yielding from time to time and pausing for a very short periods of time’ It may be tricky to finetune this). Eventually, it may wait, but it shouldnt happen that often. Wake-up events are not signalled every time task is added, only when changing queue state from empty to full (possible contention here, as I guard gate state variable, but it’s very short). I do not need to implement work-stealing, as all threads acquire tasks from one queue, so it more or less auto-balances itself. I simply spin a little bit waiting for new task to arrive. Finally, there’s one more simple optimization, which seems quite obvious. When main thread is done with its job and waits for worker threads, it doesnt just hang on semaphore, it actively tries to help them, by processing tasks as well. Result is presented at Figure 5.

Figure 5: Final lock-free implementation.

Not much point in zooming, as it’s basically a blue bar. Average concurrency is 3.58 (whole running time, including setup) with 6.29 transitions per second. CL==4 for 98% of the running time (excluding setup).

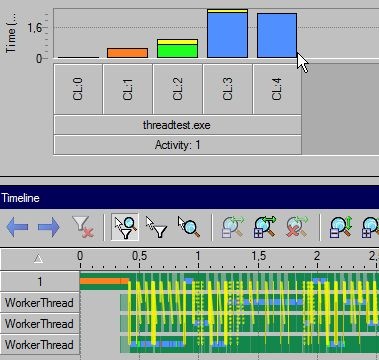
Of course, those pictures are pretty, but we shouldnt forget that our goal is to speed-up the application, not to minimize contention (it may be a way to achive this goal of course). You could easily have zero yellow bars, simply by letting worker threads spin until there’s work for them, it just wouldnt make much sense’

Anyway, what’s “real” difference between all those versions? Not that big, honestly, fractions of one frame (usually it’s ~29.3 (version 1) fps - ~29.9 (version 3) fps). I blame test machine, partially (it’s dual core and as you can see at Figure 1, the test utilizes 2-3 cores most of the time). I may test it on my quad-core work machine and will get back with the results (if they’re interesting).

As a finishing touch I added specialized, cache-friendly allocator to avoid false sharing and experimented with different kinds of queues, like the one presented in Herlihy’s book (pretty nice BTW’ with dollar so dirt cheap I’m going crazy with Amazon, I think I’ve been spending ~100USD/month on books recently, waiting for one about TBB now). It falls down to slower interlocked operations only if needed. Haven’t noticed significant performance improvements to be honest, but it takes less memory in most cases (represented as array instead of linked list) and doesnt need node allocator.

Finally, just for kicks - my take on parallel_for:

struct ApplyFoo
{
    explicit ApplyFoo(int* tab): m_tab(tab) {}
    void operator()(const rde::pair<int, int>& range)
    {
        for (int i = range.first; i != range.second; ++i)
            m_tab[i] = Foo(m_tab[i]);
    }
    int*    m_tab;
};
[...]
ApplyFoo f(&tab;[0]);
ParallelFor(pool, 0, tabSize, f);

Old comments

supzi 2008-06-13 12:50:27

Funny, synchronization can really lower performances depending on how you use it
I had the same fun some time ago, you can see that at http://supzi.wikidot.com/little-concurrency-fun-with-stl

therealremi 2008-06-13 18:14:11

Regarding the Herlihy book - I got it also but I’m a bit scared to read it cause people say lot’s of code samples have bugs. Did you notice any?

admin 2008-06-13 19:19:28

I’ve only skimmed it so far, but havent noticed bugs.

Tags// , ,
More Reading